Here are a couple of infographics that caught my attention recently. The first breaks down the ongoing digital revolution and separates indie publishing from trade publishing. I don’t agree with some of the numbers specified, but overall it’s a great overview for someone outside the industry who wants to know what’s going on in the publishing field right now.
The other graphic comes from Publishers Weekly. It perfectly showcases the complexity of modern publishing and pokes fun at the frustration that comes with it. There’s more truth to this than most insiders would like to admit.

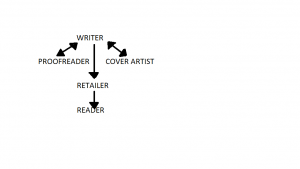
For comparison, I mocked up a similar (albeit very crude) flowchart for e-book publishing. Notice any differences? 


